Black Friday Price Monitoring 2026: How Retailers Track Competitor Prices Hour by Hour Through Cyber Week
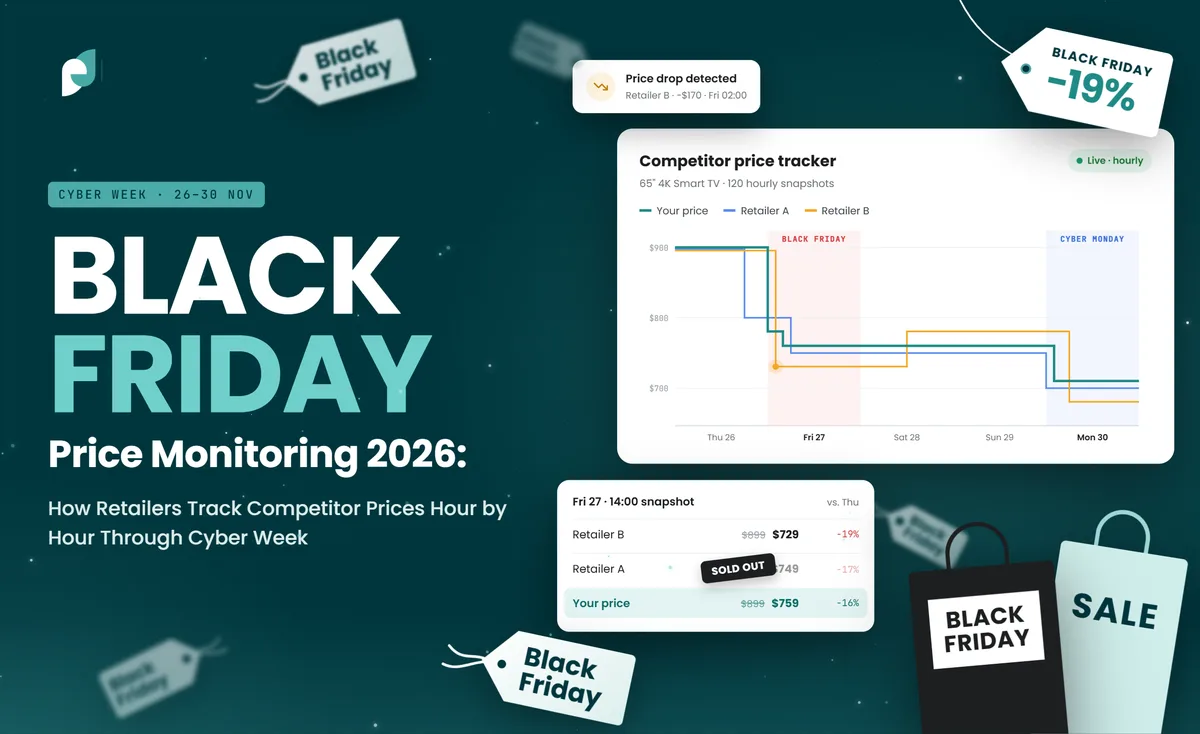
Last Black Friday, US shoppers spent $11.8 billion online, and between 10:00 and 14:00 they were spending $12.5 million a minute. Prices did not sit still while that happened. They moved in waves: the midnight drop, the mid-morning cuts, the Saturday pull-back, and a second, bigger surge on Cyber Monday. If you check competitor prices once a day, what you see is the wreckage. This is how retailers that price well through Cyber Week actually watch the market, what they watch, and how to set it up in the three weeks you have left.
In this article
The short version
- Cyber Week 2025 was $44.2 billion of US online spend in five days. Black Friday peaked at $12.5M a minute; Cyber Monday at $16M a minute between 20:00 and 22:00. Prices moved on those curves, not on a daily schedule.
- Price alone is half the picture. Discount depth, availability, shipping promise and the effective price after coupons are what decide whether a competitor's number is a threat.
- Cadence should follow the curve: daily from mid-November, every few hours from Thanksgiving evening, hourly on Black Friday and Cyber Monday.
- Peak discounts in 2025 were deepest in electronics (31%), toys (28%) and apparel (25%). Furniture and appliances barely moved. Category decides how hard you need to watch.
- You can scope, sample and run a competitor price feed for Cyber Week in under two weeks, but the order deadline for hourly coverage is 13 November.
Black Friday pricing moves in waves, and daily checks see none of them
Most price monitoring is built for a normal week: a scrape overnight, a report in the morning, a repricing decision by lunch. That works when competitors change prices a few times a month. In Cyber Week they change them a few times a day, and the changes cluster around the hours when the spending peaks.
Adobe's numbers from 2025 show where those hours are. Adobe Analytics, which tracks over a trillion visits to US retail sites, put Thanksgiving Day at $6.4 billion, Black Friday at $11.8 billion with the peak between 10:00 and 14:00 ET, and Cyber Monday at $14.25 billion with $16 million a minute spent between 20:00 and 22:00. Retailers know these curves as well as Adobe does, which is why the aggressive price moves land just before them.
Here is what that means in practice. A competitor cuts a headline SKU by 15% at 00:05 on Friday. Your overnight scrape runs at 03:00 and catches it. Your team sees it at 09:00, approves a match by 10:30, and it goes live at 11:00. By then the competitor has already restored the price for the mid-morning window and dropped a different line instead. You matched a price that no longer exists, on the busiest four hours of the year.
Black Friday price monitoring, done properly, means seeing the move inside the window it happens in. That is a different cadence, and a different set of signals, from the monitoring most teams already run. The rest of this article is the specification.
The five signals worth tracking (price is only one)
A competitor's price on its own tells you less than you would think during Cyber Week, because the number on the page is rarely the number the customer pays, and a low price on an out-of-stock item is not competition at all. The retailers who read the week well track five things per SKU per competitor.
| Signal | What it is | Why it matters in Cyber Week | Cadence |
|---|---|---|---|
| Listed price | The current price shown on the product page, per variant | The baseline. Moves several times a day on headline SKUs. | Hourly on peak days |
| Discount depth | Current price against the pre-event list or 30-day reference price | Tells you whether a cut is real or a "was" price inflated the week before. Also what shoppers compare. | Hourly on peak days |
| Availability | In stock, low stock, out of stock, backorder, store-only | A competitor's stockout is a pricing opportunity for you; their low-stock badge predicts it hours ahead. | Hourly on peak days |
| Shipping promise | Delivery date shown, free-shipping threshold, pickup availability | Late in the week, "arrives by 24 Dec" beats "5% cheaper". Changes as carriers hit cutoffs. | Every 4–6 hours |
| Effective price | Price after site coupons, bundles, card offers and visible stacking | The number the customer actually pays. Often 5–10 points below the listed price on big-box sites. | Every 4–6 hours |
Discount depth deserves a closer look, because it is where the category differences live. Adobe's peak-discount figures from Cyber Monday 2025 show electronics at 31% off list, toys at 28%, apparel at 25%, computers at 23%, televisions at 22%, and then a long drop to furniture and appliances at 19% and sporting goods at 17%.
Who needs what cadence
Hourly tracking across every SKU and every competitor is possible, but it is also expensive and mostly unnecessary. The cadence should follow two things: how fast your category moves, and how fast you can act on what you see. There is no point scraping hourly if repricing takes a day to approve.
| You are | Watch | Cadence through Cyber Week | The decision it feeds |
|---|---|---|---|
| A price-matching retailer | 5–10 direct competitors, your top 200–500 SKUs by revenue | Hourly Fri + Mon, 4-hourly Thu/Sat/Sun | Automated match with floor rules; manual review on headline SKUs |
| A marketplace seller | The Buy Box and the 3–5 sellers competing for it per ASIN | Hourly on peak days | Repricer rules; stock allocation between channels |
| A brand protecting a price floor | Every authorised reseller, plus the unauthorised ones you know about | 4-hourly, hourly on headline SKUs | Floor breaches, who to call, evidence for enforcement |
| A category manager | Category-level discount depth and stockouts across 10–20 retailers | Every 6 hours | Where to concentrate promo budget mid-week; what to re-order |
| Planning for 2027 | Everything above, stored with timestamps | Any cadence, but keep the history | Next year's promo calendar, built on what competitors actually did |
Two patterns we see every year. First, teams that monitor hourly but reprice daily get no value from the extra cadence; fix the approval loop before you buy more data. Second, brands that watch only their authorised resellers miss the moment a grey-market seller drops below the floor at 00:01 on Friday and sets the price the whole marketplace anchors on for the day. If floor protection matters, the unauthorised sellers are the ones to watch most closely. There is a longer treatment of the Amazon-specific version in our guide to monitoring competitor prices on Amazon during sales.
Writing the monitoring spec
Whether you build it or buy it, Black Friday competitor price tracking lives or dies on a one-page spec written before the week starts. Everything that goes wrong in Cyber Week monitoring traces back to something that was not written down in it. Here is what ours contains for a retail client, with illustrative values.
| Line | Example | Why it has to be explicit |
|---|---|---|
| Competitors | 8 named domains, plus 2 marketplaces with named sellers | "Our main competitors" is not a list. Ambiguity here costs days. |
| SKUs and matching | 420 SKUs; matched by GTIN where present, else by title + attributes with a confidence score | Product matching is the hardest part and the most often skipped. A wrong match is worse than no match. See cleaning and normalising web data for price matching. |
| Signals per SKU | Listed price, reference price, discount %, availability state, delivery date, visible coupon | Adding a signal mid-week means re-scraping history you no longer have. |
| Cadence calendar | Daily 9–25 Nov; 4-hourly 26 Nov; hourly 27 Nov; 4-hourly 28–29 Nov; hourly 30 Nov; daily 1–4 Dec | Cadence is the main cost driver and the main value driver. Write it per day. |
| Delivery | Google Sheet refreshed on each run + CSV to S3; Slack alert when a tracked SKU moves > 10% or goes out of stock | Data that lands in a dashboard nobody opens on Black Friday is data that did not arrive. |
| Quality checks | Row count vs expected per competitor per run; price-field fill rate > 98%; no price below 20% of reference without a manual flag | A broken scraper on Black Friday reports zero as a price. The checks are what stop that reaching your repricer. |
| Who acts | Named owner for repricing decisions, with hours of cover across the peak windows | Hourly data with nobody on shift at 00:00 Friday is a daily feed with extra cost. |
| SKU | Comp. A | Δ 1h | Comp. B | Δ 1h | Comp. C | Δ 1h |
|---|---|---|---|---|---|---|
| 65" 4K TV · X2 | $448.00 | −12% | $479.99 | +7% | $449.00 OOS | — |
| Noise-cancelling headphones | $199.00 | — | $179.00 | −10% | $199.00 | — |
| Robot vacuum · S8 | $329.00 | +9% | $299.00 | — | $319.00 Low | — |
| Air fryer 6qt | $69.99 | — | $64.99 | −7% | $69.99 | — |
| Gaming console bundle | $449.00 OOS | — | $449.00 | — | $449.00 OOS | — |
| Stand mixer · 5qt | $279.00 | −15% | $329.00 | — | $299.00 | −6% |
Calculator: your Cyber Week monitoring load
Rough sizing for the spec above. Pick your competitors, SKUs and the cadence you can act on, and this tells you the page volume per day at peak and what kind of setup it needs. No prices here; that depends on the sites.
Assumes one page fetch per SKU per competitor per run, with effective-price and shipping signals needing extra requests on some sites. A sizing model, not a quote.
Three ways it fails in the week itself
The monitoring setups that fall over in Cyber Week usually fall over for one of three reasons, and all three are predictable.
The sites change in the week before
Retailers ship their Black Friday templates, promo banners, countdown timers and "deal" badges in the seven to ten days before Thanksgiving. Every one of those is a layout change, and layout changes are what break scrapers. A parser built in October against the normal product page can return blanks on 25 November without anyone noticing until the price board is empty. The fix is a dry run on the live pages in the week of 16 November and someone whose job is to re-check on the 24th and 25th.
Bot protection tightens
Retailers know scraping spikes before Black Friday. Kasada's holiday bot report measured scraping traffic up 43% against October and overall bad-bot traffic up 50% in Black Friday week, and protection vendors respond by tightening rules for the week. Requests that passed in November can start receiving challenges on the 27th. This is a proxy and fingerprinting problem rather than a parsing problem, and it needs residential capacity reserved in advance, because everybody else is reserving it too. Our guide to proxies for web scraping covers the mechanics.
Your own volume multiplies
Going from daily to hourly is a 24× increase in requests, and the infrastructure that ran comfortably at one scrape a night may not at twenty-four. Queues back up, runs overlap, and by the time run 14 finishes, run 15's data is stale. Capacity has to be tested at peak cadence before the week, not during it.
None of this is specific to Black Friday; it is the ordinary failure pattern of web scrapers under stress, compressed into five days. If you run your own collection, the detection checks in why web scrapers break and how to catch it in hours are the ones to have in place. If you are buying the data, the thing to ask a vendor is not "do you monitor" but what they commit to in writing on detection and repair time during the week; web data SLAs explained sets out the clauses.
What to do with the data: three plays that pay for the monitoring
Hourly competitor data is only worth having if a decision changes because of it. These are the three that most often do.
Match with floors, not reflexes. Automated matching without a floor is how retailers end up selling headline SKUs below cost at 02:00 because a competitor's pricing error propagated through everyone's repricer. Set floors per SKU before the week, match within them automatically, and route anything that would breach a floor to a human. The data tells you when to move; the floor tells you when not to.
Treat stockouts as price signals. When two of three competitors show out of stock on an item, as in the console bundle above, the correct response is usually to hold or raise, not to cut. Availability is the signal most monitoring setups ignore and the one with the clearest margin impact. Low-stock badges are even better, because they arrive hours before the stockout.
Keep every timestamp for 2027. The least glamorous play and the one with the longest payback. A full record of what every competitor did, hour by hour, is the basis of next year's promotional calendar: which SKUs they led with, when they cut, when they restored, where they ran out. Most teams throw this away in December. The ones that keep it start next year's planning with evidence instead of memory.
For the broader programme beyond Cyber Week, how brands run this all year is covered in how e-commerce brands track competitor prices in real time, and the tooling landscape in top price monitoring tools. The earlier piece on using data scraping to analyse competitor pricing for Black Friday covers the product-trend side of the same week.
The Black Friday Price Intelligence Sprint
Order by Fri 13 Nov for hourly coverage · Fri 20 Nov for dailyA fixed-scope competitor price feed for Cyber Week, run by DataDwip's price intelligence team, so you get the data without building the pipeline in the three weeks you have.
- Scope: the competitors and SKUs agreed on the scoping call, matched by GTIN or attributes, all five signals.
- Cadence: daily from the day after your sample is approved; 4-hourly from Thanksgiving; hourly on Black Friday and Cyber Monday.
- Delivery: a shared sheet or dashboard refreshed every run, CSV or API to your warehouse, and Slack or email alerts on moves over a threshold you set and on stockouts.
- Quality: every run checked for coverage, fill rate and out-of-range prices before it reaches you; breakages detected within 4 hours and fixed within 24 business hours, in writing.
- Timeline: sample within 48 hours of scoping; first daily delivery within 5 business days; a wrap-up report on 1 December with everything that moved, hour by hour.
- Price: Fixed fee for the scope above, confirmed on the scoping call. If you continue into ongoing price intelligence in December, the sprint fee is credited against the first month.
Deadlines are driven by onboarding time, not marketing: a competitor added on 20 November cannot have a reference-price baseline by the 26th. Public data only; no personal data collected. Every source goes through a terms review first.
Frequently asked questions
How often should you monitor competitor prices during Black Friday?
Hourly on Black Friday and Cyber Monday, every four hours on Thanksgiving and the weekend between, and daily from mid-November to establish reference prices. The cadence should match how fast you can act: hourly data is wasted if repricing decisions take a day to approve. Electronics, toys and apparel move fastest and justify the hourly tier; furniture and appliances moved far less in 2025.
What should Black Friday competitor price tracking include besides the price?
Discount depth against a reference price, availability state, shipping promise and the effective price after visible coupons and bundles. A low price on an out-of-stock item is not competition, and a 10% cut from a "was" price inflated the week before is not a discount. Availability is the most under-used signal: two competitors out of stock is a hold-price signal, not a cut signal.
Is Cyber Monday price monitoring different from Black Friday?
Yes, in timing. In 2025 Cyber Monday was the bigger day ($14.25 billion against $11.8 billion) and its peak came between 20:00 and 22:00 ET, against Black Friday's 10:00 to 14:00. Prices on Saturday and Sunday tend to creep back up and then drop again on Monday afternoon. Treat the five days as one window with two separate peaks, and keep hourly cadence on both.
How do brands protect a price floor or MAP during Black Friday?
By monitoring every reseller, including the unauthorised ones, at least four-hourly, with hourly checks on headline SKUs, and by keeping timestamped evidence of each breach. The sellers who break a floor usually do it at 00:01 on Friday, and the breach sets the anchor for the day. Monitoring only authorised resellers misses it.
How late can you set up Black Friday price monitoring?
For hourly coverage with proper reference-price baselines, scope needs to be fixed by around 13 November: competitor list, SKU list and matching rules. A sample can be delivered within 48 hours and a daily feed within five business days, but each competitor needs a week or more of daily data to establish what "normal" looks like before the week starts. Daily-only coverage can start as late as 20 November.
What breaks price monitoring during Cyber Week?
Three things: retailers shipping their Black Friday page templates in the week before (layout changes that blank out parsers), bot protection tightening for the week (requests that passed in October get challenged on the 27th), and the 24× volume increase from moving to hourly cadence. All three are predictable and all three are caught by a dry run on live pages on 24–25 November and reserved proxy capacity.
Three weeks is enough, if the scope is fixed this week.
Send us your competitor list and your top SKUs and we'll come back within one business day with a matching sample and a cadence plan. No commitment until you've seen real data from your competitors' pages.
Related reading
- Adobe Analytics, Cyber Monday hits record $14.25 billion in online spending (December 2025) — Cyber Week totals, per-minute peaks, discount depth by category
- TechCrunch, Black Friday sets online spending record of $11.8B, Adobe says — Black Friday 2025 total and the 10:00–14:00 peak
- Talk Business & Politics, Adobe Analytics: online holiday sales grew 6.8% to $257.8 billion — season totals and season-wide discount peaks
- Kasada, How bots impacted holiday sales — scraping and bad-bot traffic increases in Black Friday week
Prices on the illustrative board are examples. Adobe figures are for US online retail. Dates refer to Cyber Week 2026: Thanksgiving 26 Nov, Black Friday 27 Nov, Cyber Monday 30 Nov.