Why Web Scrapers Break: Layout Changes, Anti-Bot Updates and Schema Drift (and How to Catch Them in Hours)
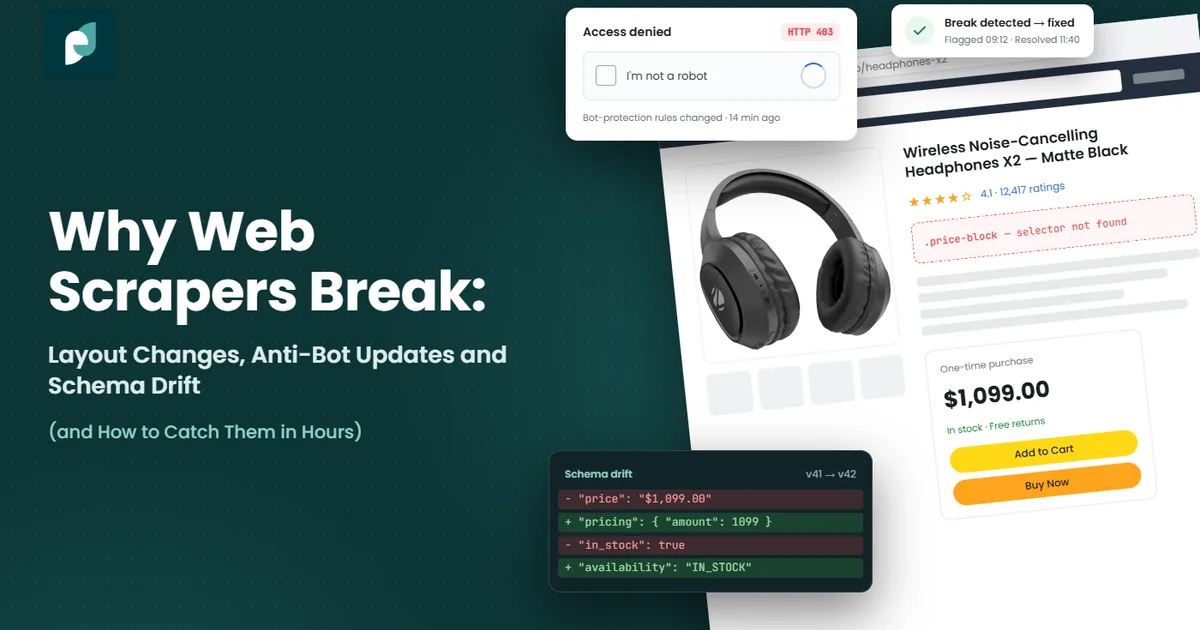
The scraper that crashes is the easy one. Someone gets paged, someone fixes it, the data is late by a morning. The expensive failure is the one that finishes cleanly, reports success, and writes wrong numbers into your warehouse for a week before a customer notices. Here are the four ways scrapers actually break, how to tell them apart in minutes, and the checks that catch the silent ones.
In this article
The short version
- Sources change structure about 2.6 times a year each. At 40 sources that is a break every three or four days.
- Breakages come in four kinds: layout changes, anti-bot updates, schema drift and coverage loss. They need different fixes, and three of the four can return a clean HTTP 200.
- Infrastructure failures surface in minutes. Field-level failures, unmonitored, take three to five days to surface through someone noticing an odd number downstream.
- With weekly quality checks, a silent failure runs 3.5 days on average. With monthly checks, 15 days. At 10,000 records a day that is 35,000 to 150,000 bad rows.
- Catching breaks in hours is not a smarter parser. It is nine specific checks run on every delivery, with thresholds and an owner.
Two failures, one log line
Here are two runs of the same scraper, a week apart. The scheduler reported success both times.
Monday, working
12:00:09 212 category pages queued
12:14:51 4,850 product URLs found
12:41:30 parsed 4,812 / 4,850
12:41:31 price populated 99.2%
12:41:33 written 4,812 rows
12:41:33 exit 0 — SUCCESS
38 products missed, prices present, nothing to do.
Monday, broken
12:00:08 212 category pages queued
12:15:02 4,844 product URLs found
12:40:11 parsed 4,804 / 4,844
12:40:12 price populated 9.1%
12:40:14 written 4,804 rows
12:40:14 exit 0 — SUCCESS
The site moved the price into a JSON blob. Same exit code.
This is the heart of the problem. A scraper is not one system, it is a chain: fetch, render, parse, validate, deliver. Monitoring usually watches the first link and the last one. The breakages that cost money happen in the middle, where the job still succeeds and the data is already wrong.
So the question "why do web scrapers break" has a boring answer and a useful one. The boring answer is that websites change. The useful answer is that they change in four distinct ways, each with a different symptom, a different fix, and a different chance of being noticed.
The four ways a scraper breaks
Over a few hundred sources, almost every incident we see falls into one of four buckets. Sorting an incident into the right bucket within the first ten minutes is most of the repair time saved, because each bucket has a different first move.
1. Layout changes
The most common and the most boring. A site ships a redesign, renames a CSS class, wraps a price in a new span, or starts rendering a field client-side that used to be in the HTML. Your selector no longer matches, and the field comes back empty.
Layout changes are not rare events that happen during annual redesigns. Modern sites ship continuously and run A/B tests, which means a fraction of your requests may see a variant layout while the rest look normal. That is why a quick manual spot check is such a poor test: if 10% of requests get the variant, three spot checks all pass about 73% of the time. You check, it looks fine, and the field is still broken for one request in ten.
2. Anti-bot updates
The loudest failure, and the only one that usually announces itself. A protection vendor ships a change and your previously fine requests start getting challenged. In 2026 the detection stack works on three layers at once: TLS fingerprints (JA3/JA4-style, built from cipher suites and extension order), HTTP-layer signals (header order and casing, HTTP/2 frame order, cookie shape), and behavioural scoring across a session. Crawlbase's 2026 engineering guide logs vendor changes through the year at a pace of roughly one a month across Cloudflare, DataDome and Akamai, including Cloudflare's Adaptive Intelligence in August, which retrains continuously on live traffic rather than shipping as a discrete rule update.
Continuous retraining matters for maintenance planning, because it means there is no version number to track. A source that has worked for six months can start failing on a Tuesday with no announcement anywhere.
The useful thing about anti-bot failures is that they leave evidence. You get a 403 or a 429 with block detail in the headers, or a challenge page, which Cloudflare marks with a cf-mitigated: challenge header. The trap is the soft block: HTTP 200, a normal-looking page, and fields that are empty or implausible. That one looks exactly like a layout change until you compare the response headers against a known-good capture.
3. Schema drift
The quietest and the most expensive. Schema drift is when the field still parses but no longer means what it used to. A price switches from 1,299.00 to 1299, and a parser that strips commas now reads a different number. A site starts returning prices including tax. A rating moves from a five-point scale to a hundred-point one. A date flips from MM/DD to DD/MM, which is invisible for twelve days a month and wrong for the rest.
None of these trip a null check. The field is populated, the type is right, the value is in a plausible range. What changed is the meaning, and meaning is only visible in the distribution: the mean moves, or the share of values in a bucket shifts, or the max jumps by an order of magnitude. PromptCloud's write-up on monitoring lists undetected schema drift as one of the ten standard gaps: renamed fields, type changes and new variants flow downstream while the job still reports success.
4. Coverage loss
The scraper works perfectly on everything it reaches, and quietly stops reaching things. A pagination control changes from numbered pages to infinite scroll and you collect page one only. A category disappears from the nav. A filter that used to return 500 results now caps at 200. A sitemap stops updating.
Field-level checks all pass, because the rows you did get are perfect. The only signal is volume, and volume moves for legitimate reasons too, which is why coverage loss needs a per-source baseline rather than a fixed threshold.
| Mode | Typical trigger | HTTP status | What the data looks like | Catches it |
|---|---|---|---|---|
| Anti-bot | Vendor rule or model update | 403 / 429 / 200 | Empty, or a challenge page parsed as content | Status and header checks |
| Coverage loss | Pagination, nav or filter change | 200 | Correct, just less of it | Volume vs baseline |
| Layout change | Redesign, A/B test, client-side render | 200 | Nulls in one or two fields | Fill rate per field |
| Schema drift | Format, unit or scale change | 200 | Plausible but wrong | Distribution drift |
Diagnose it: pick the symptom, get the first check
Most of the repair time in a scraper incident goes on working out which of the four things happened. Pick what you are seeing and this gives you the likely cause and the check that confirms it.
- Confirm it with
- Usual fix
- Watch out for
A model based on the incidents we see most often, not a substitute for reading the response.
How long a silent failure runs
Once a break is silent, the only thing that decides how much bad data you ship is how often you check. This is the uncomfortable arithmetic, and it is worth sitting with.
Phyllo's failure-rate analysis models the average life of a silent failure against the cadence of quality checks. If you validate daily, a silent break runs for about half a day before you catch it. Weekly, 3.5 days. Monthly, 15 days. Quarterly, 45 days. Those are averages: a break that lands the day after a check runs for the full interval.
Set against that, here is the number that should decide your monitoring budget. PromptCloud's production observations put detection of infrastructure failures at minutes, and detection of field-level completeness failures, when nobody is actively monitoring them, at an average of three to five days — discovered not by an alert but by somebody downstream noticing a reporting discrepancy and asking a question.
Three to five days is the default state of a pipeline that has monitoring but not data monitoring. And that is for completeness, the easiest silent failure to spot. Schema drift usually runs longer, because nothing is missing at all.
Why standard monitoring misses all of this
Teams who get burned by this are rarely careless. They have monitoring. It is watching the wrong layer. Five specific gaps come up again and again:
- Job success is read as data success. Exit code zero means the process finished, not that it finished with the right output. Almost every silent failure in this article exits zero.
- Infrastructure metrics have nothing to say about content. Latency and status codes look identical whether a page yields 40 populated fields or 40 blanks.
- There is no baseline. Without a per-source history, 4,804 rows is just a number. Against a 30-day median of 4,850 it is normal; against 12,000 it is an incident.
- Freshness is measured by run time, not content. A job that ran at 06:00 and returned yesterday's cached page is both on time and stale.
- Alerts are undifferentiated, so they get muted. When a transient timeout and a 90% drop in price coverage produce the same notification, people learn to ignore both.
The fix is not a better parser or a cleverer framework. It is moving the checks from the process to the data, and giving each check a threshold, a cadence and a named owner.
Not sure which of your sources are drifting right now?
Send us your source list and we'll run a free audit: which sites are protected, how often each one has changed structure in the last quarter, and which fields are already arriving degraded.
The nine checks that catch a break in hours
This is the set we run on every delivery, for every source. Individually none is clever. Together they close the gap between "the job succeeded" and "the data is right", and they are what turns a three-to-five-day discovery into a four-hour one.
Two practical notes. First, thresholds should be per source: a marketplace whose catalogue turns over weekly needs a wider volume band than a government register. Second, keep a known-event calendar — Black Friday, a seasonal catalogue change, a site migration you were told about — and suppress the expected alarms, or people will learn to ignore the real ones.
If you want the checks that run after the data lands, our piece on cleaning and normalising scraped data covers the matching and normalisation layer that sits on top of this.
From alert to fix: a triage runbook
A check that fires at 03:40 and is read at 10:00 has saved you nothing. What makes the difference between a four-hour repair and a four-day one is having the path from alert to verified fix written down before the alert happens.
Three details matter more than they look.
Keep known-good captures. Store the raw HTML and the response headers from a run you know was correct, per source. Diagnosing a break by comparing today's response to a good one takes minutes; diagnosing it by reading the live page and guessing takes hours. This is also the only way to tell a soft block from a layout change with confidence.
Backfill the whole window. When you find a break that started on Tuesday and fix it on Friday, the fix is only half the job. The rows written between Tuesday and Friday are still wrong, and they are now sitting in reports. Re-collect the window, or at minimum mark it as suspect so downstream consumers can exclude it.
Write a test that would have failed. Every repair should leave behind a regression test pinned to the specific thing that changed. Over a year this is what separates a source list that gets more stable from one that breaks in the same four ways forever.
What it looks like when someone owns this
Everything above is doable in house. It is also roughly a half-time job once you pass twenty or thirty sources, which is the finding of our piece on the true cost of an in-house web scraping engineer: maintenance alone eats about 40% of the engineer's year at 40 sources.
Our dedicated data acquisition teams exist because this work is unglamorous, continuous, and badly suited to being one person's side responsibility. What the client gets is the detection system rather than the promise of careful work:
- All nine checks on every delivery, with per-source thresholds, plus six validation layers before anything is handed over.
- A written SLA with service credits: breakages detected within 4 hours and repaired within 24 business hours, 95% of deliveries on time, at least 97% coverage per source per run, 99% of records passing validation.
- 30 days' notice on breaking schema changes, so drift on our side never arrives as a surprise on yours.
- A weekly source-health digest showing every source, what changed, when it was detected and how long the repair took — the maintenance made visible instead of invoiced blind.
- A QA lead who does not write the scrapers they check, which is the separation that makes the canary checks meaningful.
You can see the same machinery running in two production workloads: a daily hotel rate pipeline across OTAs, where layouts and anti-bot rules both change constantly, and a continuous tyre pricing feed where schema drift on units would quietly corrupt a pricing model.
If you are earlier than that — a one-off dataset, or a first project — our web scraping services page is the better starting point, and enterprise web crawling covers the very large crawls. Every source goes through a terms and robots review first; we collect public data only, and no personal data by default, as we set out in web scraping laws and ethics.
The Source-Health Monitoring Pack
The nine checks as a spec you can hand to an engineer: thresholds, cadence, what each one catches and what it misses. Plus the triage runbook from this article as a one-page flow, and the alert-severity table we use so the important alarms stay loud.
- The nine checks: definition, threshold, cadence, failure mode caught
- Triage runbook: alert → classify → reproduce → patch → backfill → verify
- Alert severity table and a known-event suppression calendar template
- Known-good capture: what to store per source and for how long
- The SLA targets we hold ourselves to, for comparison
Frequently asked questions
Why do web scrapers break so often?
Because the thing they depend on is not an interface with a contract, it is someone else's web page, which changes whenever that team ships. Measured across one portfolio of marketplaces, structural changes land about 2.6 times per source per year, and anti-bot updates come on top of that at roughly one vendor change a month across the major protection providers. At 40 sources, that is a break every three or four days.
What is schema drift in web scraping?
Schema drift is when a field still parses correctly but no longer means what it did: a price that starts including tax, a rating that moves from a 5-point to a 100-point scale, a date that flips from US to European order, a number that loses its thousands separator. Nothing is null and no type check fails, so it passes every standard validation. The only reliable detection is comparing the field's distribution against recent history.
How do I know if my scraper is blocked or just broken?
Check the response before the parse. A block usually leaves evidence: a 403 or 429, a challenge page, a cf-mitigated header, or vendor cookies and endpoints that were not in your known-good capture. A layout change returns an ordinary page where the expected element is simply absent from the raw HTML. The confusing case is a soft block, which returns HTTP 200 with empty fields and looks exactly like a layout change until you compare headers.
How often should I run data quality checks on scraped data?
Every run, not on a schedule of their own. The checks that matter are cheap enough to run on each delivery, and the difference is large: a silent failure averages half a day with daily validation and 3.5 days with weekly validation, which at 10,000 records a day is 5,000 bad records versus 35,000.
Can't AI or self-healing scrapers fix this automatically?
Partly. Model-assisted parsing genuinely helps with layout changes, since it can often locate a moved field without a hand-written selector. It helps much less with the other three modes: it cannot tell you that a price now includes tax, that a category vanished from the nav, or that a 200 response is a soft block. Automated repair also needs the same validation layer to know whether its own fix worked, so the checks are a prerequisite rather than an alternative.
What is a reasonable repair time to expect from a data vendor?
Ask for two numbers in writing, not one: time to detect and time to repair. We hold ourselves to detection within 4 hours and repair within 24 business hours, with service credits attached. A vendor who will only commit to "we monitor continuously" without a detection target is describing an intention, not a service level.
Want this running on your sources next month instead of next quarter?
A 4-week pilot starts at $3,000 and ends with a scorecard against the same SLA: freshness, coverage, quality and repair time. First data lands on day five, and you keep the code and data whatever you decide afterwards.
Related reading
- Phyllo, Why scrapers break: a failure rate analysis — structural change rate and silent-failure duration by check cadence
- PromptCloud, Web scraping monitoring challenges — detection times and the monitoring gap list
- Crawlbase, Bot detection in 2026: diagnosing scraper failures across Cloudflare, DataDome and Akamai — detection layers, vendor change timeline and block signatures
- Grepsr, How to monitor and detect data quality declines — validation and statistical monitoring checks
- ProWebScraper, The hidden labour of scraper maintenance — per-incident repair time
Figures are current as of October 2026 and will be refreshed annually. Thresholds given are our working defaults; yours should be tuned per source.